
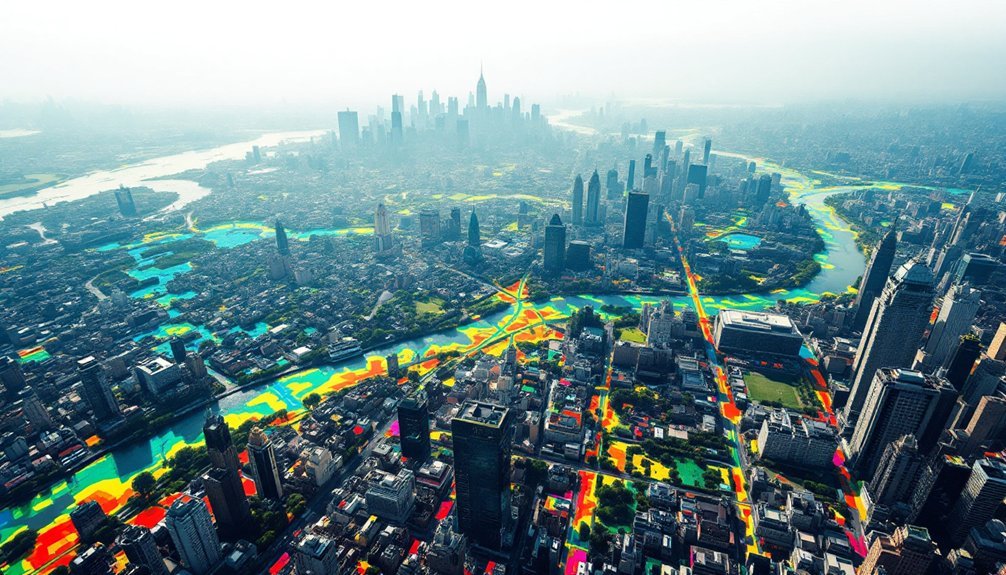
Modern cities use heat maps to help you understand where birds concentrate and move throughout urban areas. You'll find detailed visualizations showing bird density across one-kilometer sections, with brighter colors indicating higher populations. These maps combine data from radar surveillance, satellite tracking, and citizen science platforms like eBird. They reveal critical hotspots in parks, waterfront areas, and green spaces. Exploring these dynamic mapping tools opens up fascinating insights into urban bird behavior and migration patterns.
Urban Bird Population Density: Understanding Heat Map Data

While tracking bird populations poses unique challenges in urban environments, heat maps have become invaluable tools for understanding species distribution and density patterns.
You'll find that urban areas actually support higher bird densities than rural regions, though you'll need to account for factors like noise and visibility when interpreting the data.
When you examine eBird Trends maps, you can spot vital patterns in population density across cities.
These heat maps reveal that larger greenspaces notably boost bird diversity, more so than how well these spaces connect to each other. A study found that greenspace connectivity had 7 to 12 times less impact on bird diversity than total greenspace area.
You'll notice that successful urban species tend to be smaller and more mobile, with varied diets that help them thrive in city environments.
Understanding these patterns through heat maps helps guide effective conservation strategies and urban planning decisions.
Tracking Migration Patterns Through Digital Mapping
You'll find advanced digital tracking technologies transforming how we monitor bird migration patterns, with tools like radar surveillance and satellite transmitters providing unprecedented real-time movement data.
These digital mapping systems display migration traffic rates across one-kilometer transects, measuring the number of birds flying per hour in different regions. Through platforms like BirdCast and the Bird Migration Explorer, you can observe detailed heat maps showing the density and flow of migrating birds across urban landscapes.
These digital mapping systems help you understand vital flight paths and stopover points, enabling better conservation strategies for protecting urban bird populations.
Digital Migration Data Collection
The integration of digital mapping technologies has revolutionized how researchers track and analyze bird migration patterns.
You'll find that modern data collection methods now combine social media insights, remote sensing technologies, and satellite imagery to create extensive migration profiles.
When you're studying bird populations, you can leverage tools like the eBird Status Models and Genoscape Project to gather real-time data. Geographic Information Systems GIS applications enable precise visualization and analysis of bird movement corridors across urban landscapes.
These platforms allow you to analyze genetic information and track abundance patterns across different regions.
You'll also benefit from machine learning models that predict migration trends based on environmental factors and historical data.
While you might face challenges with data standardization and platform integration, innovative solutions like the Ushahidi platform and FrontlineSMS help you collect crowd-sourced information, making bird migration tracking more accurate and accessible than ever before.
Real-Time Movement Analysis
Modern radar surveillance technology has transformed real-time bird migration tracking. Through BirdCast's sophisticated system, you'll see heat maps displaying nightly bird movements, with brighter colors indicating higher migration densities.
The migration traffic rate (MTR) shows you exactly how many birds per kilometer per hour are crossing specific areas. You can track when birds take flight, typically 30-45 minutes after sunset, and monitor their remarkable marathon flights that can last over 100 hours.
The dual-polarization radar technology provides precise detection, while integration with weather data offers thorough migration forecasts. When you're checking these maps, you'll notice that environmental factors like wind, rain, and light pollution greatly impact flight patterns.
This data helps target conservation efforts during peak migration periods. Colorado State University and Cornell maintain and enhance this alert system through their collaborative expertise.
Urban Flight Path Mapping
While traditional bird tracking relied on manual observation, digital mapping has revolutionized how we monitor urban flight paths. You'll find that eBird Trends maps and BirdCast migration maps now provide hyper-local insights at scales as small as 27 x 27 km, showing detailed population changes and movement patterns.
When you're analyzing urban flight paths, you'll need to evaluate wind fields and obstacle avoidance techniques. Recent studies demonstrate that energy-efficient paths can significantly reduce power consumption compared to standard routes. The integration of Theta* algorithms and quad-tree decomposition helps create efficient search spaces for both bird and drone navigation.
You'll see how these tools transform complex 3D environments into manageable 2D models.
To track migration patterns effectively, you'll want to focus on areas where species are increasing or declining, using color-gradient maps that display migration intensity based on traffic rates.
Technology and Tools for Urban Bird Monitoring
Modern digital platforms let you track urban bird populations with unprecedented precision through interactive heat maps and real-time monitoring systems.
Advanced radar detection systems like MERLIN provide highly accurate bird monitoring capabilities while helping cities manage potential conflicts between birds and urban infrastructure.
You'll find smart urban tracking tools, from AI-powered bird feeders to automated telemetry stations, working together to create extensive population data across city landscapes.
Digital Monitoring Platforms
As cities expand and evolve, digital monitoring platforms have revolutionized how researchers track urban bird populations. You'll find extensive species observation records on platforms like eBird and GBIF, which combine community science with sophisticated digital databases. Citizen data collection has been an integral part of species monitoring since the 19th century.
These tools provide high-resolution mapping at small spatial scales, making it easier to understand bird distribution patterns in urban environments.
- eBird Trends maps track population changes across 850+ bird species
- Baidu Street View enables virtual surveys without extensive fieldwork
- GBIF's open-access database delivers thorough species records
- MAPS Program focuses on avian productivity and survivorship data
You can now access real-time data that's both cost-effective and time-efficient, though it's worth noting that species identification through digital platforms still has limitations.
These tools continue to shape urban planning and conservation efforts through their detailed spatial analysis capabilities.
Smart Urban Tracking Systems
Building on digital monitoring platforms, smart urban tracking systems represent the next wave of bird population surveillance technology.
You'll find these systems combining AI-based computer vision with high-resolution PTZ cameras to detect and classify bird species in real-time. GPU-accelerated processing guarantees swift analysis of vast amounts of video data.
The Motus tracking network adds another dimension with its VHF radio tags and over 900 receiving stations worldwide. This international network has successfully tracked over 43,600 tagged animals globally, including butterflies, bats, and birds.
You can now monitor even small songbirds as they navigate urban environments, thanks to lightweight tags. These systems are proving invaluable across multiple applications – from preventing bird strikes at airports to protecting species at wind farms.
The collected data's public accessibility means you can contribute to international research efforts while helping shape urban conservation strategies.
Seasonal Shifts in City Bird Distribution

While urban environments might seem static, city bird populations undergo remarkable seasonal transformations throughout the year.
You'll notice distinct changes in species composition as migratory birds move between breeding and non-breeding seasons, especially in mid-latitude cities. Environmental filtering and urban conditions affect these seasonal patterns differently, with some species thriving while others decline. Urban specialists make up a surprisingly small percentage of city bird populations, typically less than 5%.
- Insectivorous birds become less common in cities due to reduced insect populations.
- Omnivores and granivores thrive year-round, taking advantage of human food sources.
- Winter and spring assemblages differ greatly, with unique species compositions.
- Local conditions create distinct patterns across different cities, making each urban environment unique.
You'll find these seasonal shifts are particularly noticeable in cities like Phoenix, which shows richer bird assemblages compared to Fresno and Tucson, reflecting the dynamic nature of urban ecosystems.
Critical Urban Hotspots and Congregation Areas
Modern cities harbor surprising concentrations of bird activity in specific locations that serve as crucial urban wildlife hubs.
Urban environments create unexpected wildlife sanctuaries, where birds thrive in concentrated pockets throughout our concrete landscapes.
You'll find peregrine falcons nesting on skyscraper ledges, while cliff swallows transform bridge undersides into bustling colonies. Many spring and fall migrants pass through urban areas during their seasonal journeys, making temporary stops to rest and refuel. Waterfront areas and city parks create significant congregation points where you can spot diverse species from gulls to herons.
Even industrial zones and parking lots become temporary habitats, particularly near food sources or water bodies.
You'll notice that green roofs and urban wetlands act as oases for both resident and migratory birds, while utility poles often host exotic species like monk parakeets.
In suburbs, where there's more green space, you'll discover higher bird diversity compared to dense urban cores, especially in areas with native plant gardens and preserved tree canopies.
Green Space Impact on Bird Population Density

These urban hotspots connect directly to a broader pattern: the essential role of green spaces in supporting bird populations.
You'll find that larger, interconnected green spaces create thriving bird communities, while fragmented areas show reduced diversity. The configuration of these spaces – whether through land-sparing or land-sharing models – greatly influences which species you'll encounter in your city.
- Large, continuous parks attract more species and support birds with short life cycles, like stonechats.
- Interconnected smaller green spaces benefit birds with longer life cycles, such as great tits.
- Dense vegetation and available tree cavities increase population density.
- High human activity and residential density reduce bird concentrations.
Understanding these patterns helps urban planners create effective green spaces that maximize bird population density while balancing city development needs.
Future Trends in Urban Bird Movement Analysis
Recent breakthroughs in bird tracking technology and citizen science platforms are revolutionizing how we analyze urban bird movements.
You'll soon see more detailed heat maps at 27 x 27 km resolution, allowing you to track bird populations with unprecedented precision. These maps will help you understand how species adapt to urban environments and identify areas needing urgent conservation.
High-resolution heat maps reveal urban bird movements in stunning detail, transforming our understanding of species adaptation and conservation priorities.
You can expect advanced mapping techniques to reveal complex patterns of bird movement along urban gradients, while accounting for climate change impacts and species turnover.
The integration of habitat variables with population data will give you deeper insights into how birds respond to urbanization.
Through platforms like eBird, you'll be able to contribute to a growing database that helps predict future bird movement patterns and guides conservation efforts.
Frequently Asked Questions
How Do Artificial Light Patterns Affect Nocturnal Bird Movement in Cities?
You'll notice artificial lights disorient nocturnal birds, causing them to circle, slow down, and vocalize more. They'll gather around bright sources, disrupting their migration patterns and potentially creating dangerous ecological traps in cities.
Can Urban Noise Pollution Be Mapped Alongside Bird Population Distributions?
You can overlay noise pollution data with bird population surveys using GIS tools, creating detailed heat maps that show how urban sound levels correlate with avian distributions across your city's neighborhoods.
What Role Do Building Heights Play in Urban Bird Population Density?
You'll find that building heights between 18-30 meters boost bird populations by creating microhabitats, while extremely tall structures can fragment habitats. Mixed building heights generally support greater bird diversity in urban areas.
How Do Underground Transportation Systems Impact Bird Congregation Patterns Above Ground?
You'll notice that underground transit systems reduce above-ground traffic noise and vibrations, creating quieter spaces where birds can gather more freely. This leads to increased bird activity in areas above subway lines.
Do Different Construction Materials Affect Bird Population Clusters in City Areas?
You'll notice different materials greatly affect where birds cluster. Reflective glass causes them to avoid certain areas, while porous surfaces and natural materials like stone or wood attract more birds to specific locations.
In Summary
You've witnessed how heat mapping revolutionizes our understanding of urban bird populations. As you track these dynamic patterns, you'll find that digital tools make it easier to identify essential hotspots and migration trends. Whether you're planning green spaces or monitoring seasonal shifts, you'll see that this data-driven approach helps protect our urban birds while adapting to their changing behaviors in modern cities.


Leave a Reply